- PhD in statistics, from QUT & Paris-Dauphine
- Honours in Bioinformatics (Griffith), BSc in Statistics (Otago)
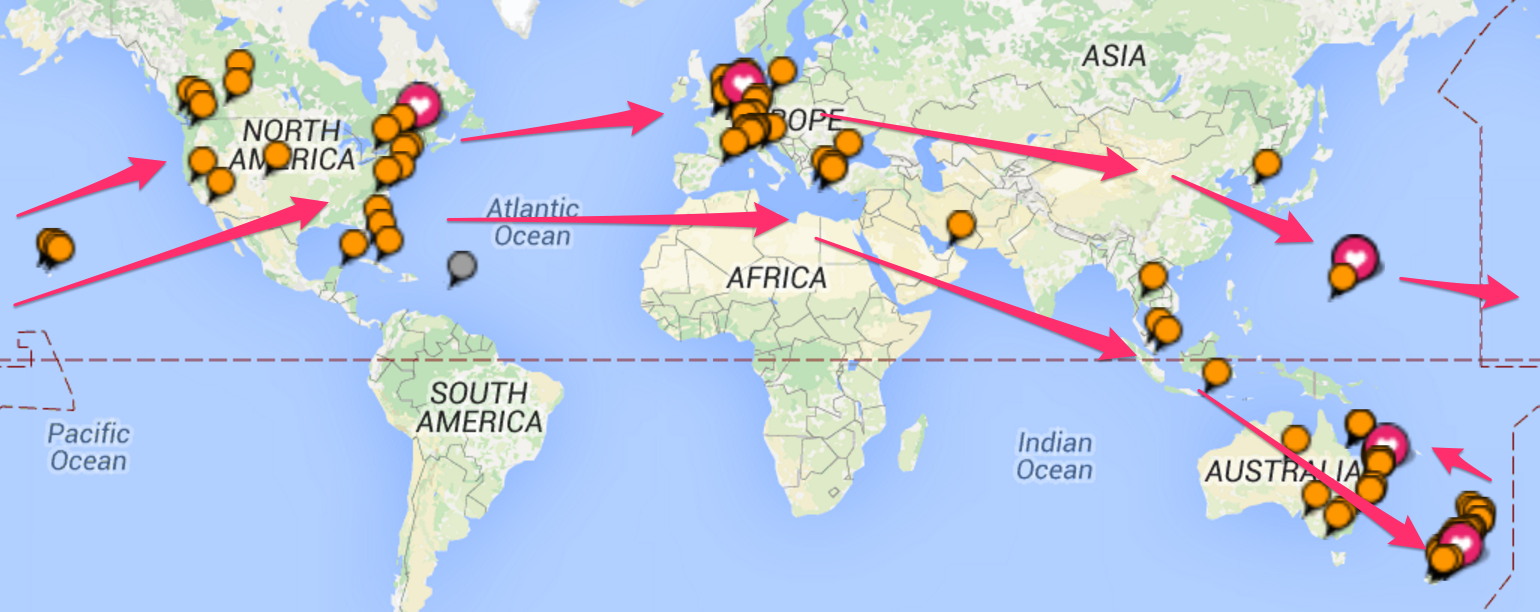
- I now live in Brisbane, by way of a few places
2016-02-18
Who am I?
Who am I?
- Key areas
 Bayesian statistics
- Mixture and hidden Markov models,
- Bio-statistics/informatics/security,
- Research interests
- Data driven, accessible, intuitive tools.
- Making data analysis easier!
What drives me?
The most common question asked since I started to pursue Statistics has been:
"Why…?"
I can share my top three reasons!
- A sense of urgency,
- tantalizing hope, and
- boundless excitement.
Urgency
Race against inexorable growth
The exponential growth of computing is not slowing down!
It is notoriously hard for our brain to really comprehend what this means.
- If we symbolize ALL of our computational advances to date by this dot \(\rightarrow \cdot\)
- In 10 years this is what we will be dealing with:

Hope
Opinions are changing fast, and everyone is coming on-board!
- There are low hanging fruits to make better, easier tools.
- the traditional way: adapt asymptotic theory to realistic sample sizes.
- the future?: take advantage of the features of Big Data (i.e. closer to the underlying truth).
"Big" data
Excitement
Better tools make data analysis easier
Amazing things happen when data analysis combines clear research questions, appropriate data, and suitable, accessible tools.
- Accessibility: easy to use, AND understand what the tool does.
- Simpler models lead to fewer mistakes.
- People will surprise you, if allowed.
- It doesn't have to be just "analysis"! It can be exploration, discovery, and more than a little exciting.
Excitement
A short story about Alzheimer's Disease
featuring… overfitted mixture models!
Key background
Alzheimer's Disease (AD) currently affects over 342,800 Australians, and this number is expected to rise to 900,000 by 2050.
Cognitive changes occur very late in the disease (\(\geq\) 20 years).
During this time, AD causes irreversible damage to the brain!
- Best detection tool we have: imaging of amyloid \(\beta\)
The data
SUVR available for 393 individuals: 290 HC, and 103 AD
Originally, compared AD to HC, and so on…
But something quite interesting is happening here.
Data overview
Histograms of Healthy Controls (HC)

"Healthy" control…?
We expect some HC's have early stage AD.
This means the HC data must contain a mixture of individuals, HC and not.
But if different subgroups exist, can't compare AD to HC!
Undetected subgroups can cause problems…
Undetected subgroups can cause problems…

Overfitting with Zmix
Data-driven modelling of mixture models with an unknown number of groups.
Overfitting with Zmix
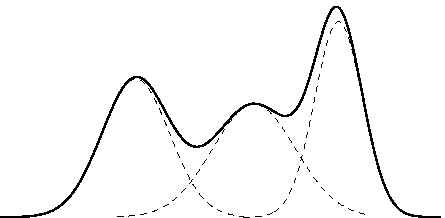
We have a mixture distribution with an unknown number of groups.
Traditionally, these can be quite painful!
- Much easier to just include too many groups in one mixture model.
- Can use prior to tell model what to do with unnecessary groups.
- Model + computational tools available in R package Zmix.
- Based on recent developments in Bayesian asymptotic theory.
How it's done
Install the package
devtools::install_github('zoevanhavre/Zmix') # Thank you Hadley!
library(Zmix)
Run the model (with 5 groups)
Zmix.Y<-Zmix_univ_tempered (Y, iter=50000, k=5)
Process the results
Proc.Zmix.Y<-Process_Output_Zmix(Zmix.Y, Burn=25000)
Overfitting the SUVR data
Results
What do the groups look like?
Mixture models: HC data

Mixture models: HC and AD data

OK, let's zoom out
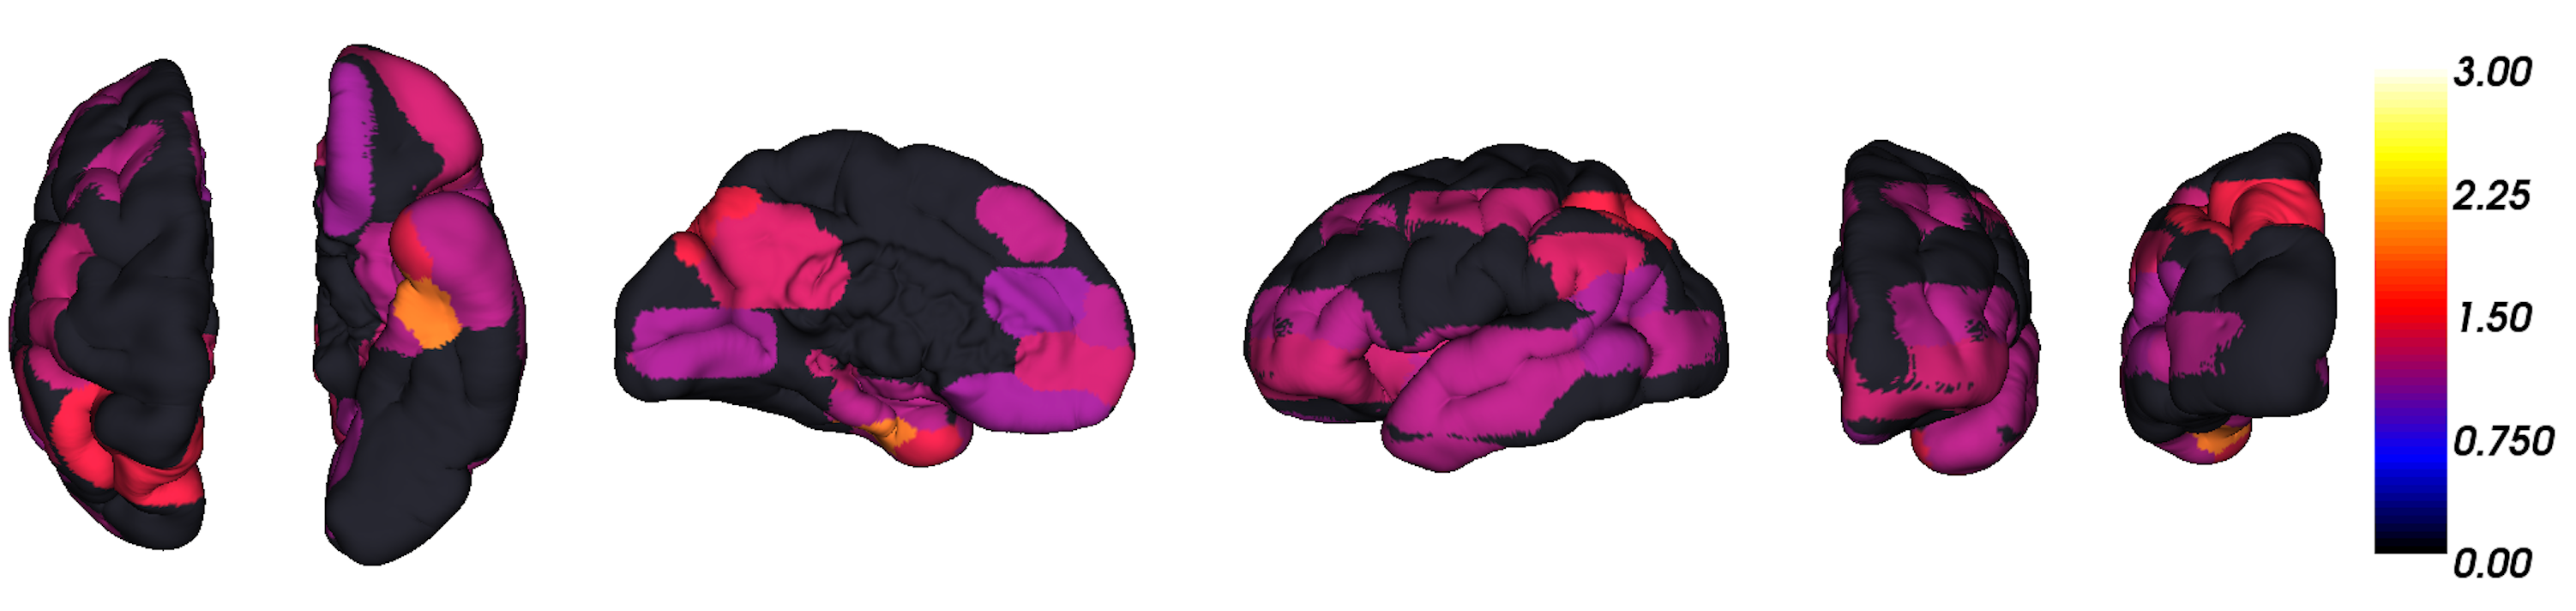
SUVR by group: HC

SUVR by group: HC and AD

Looking at individuals
Structure of results

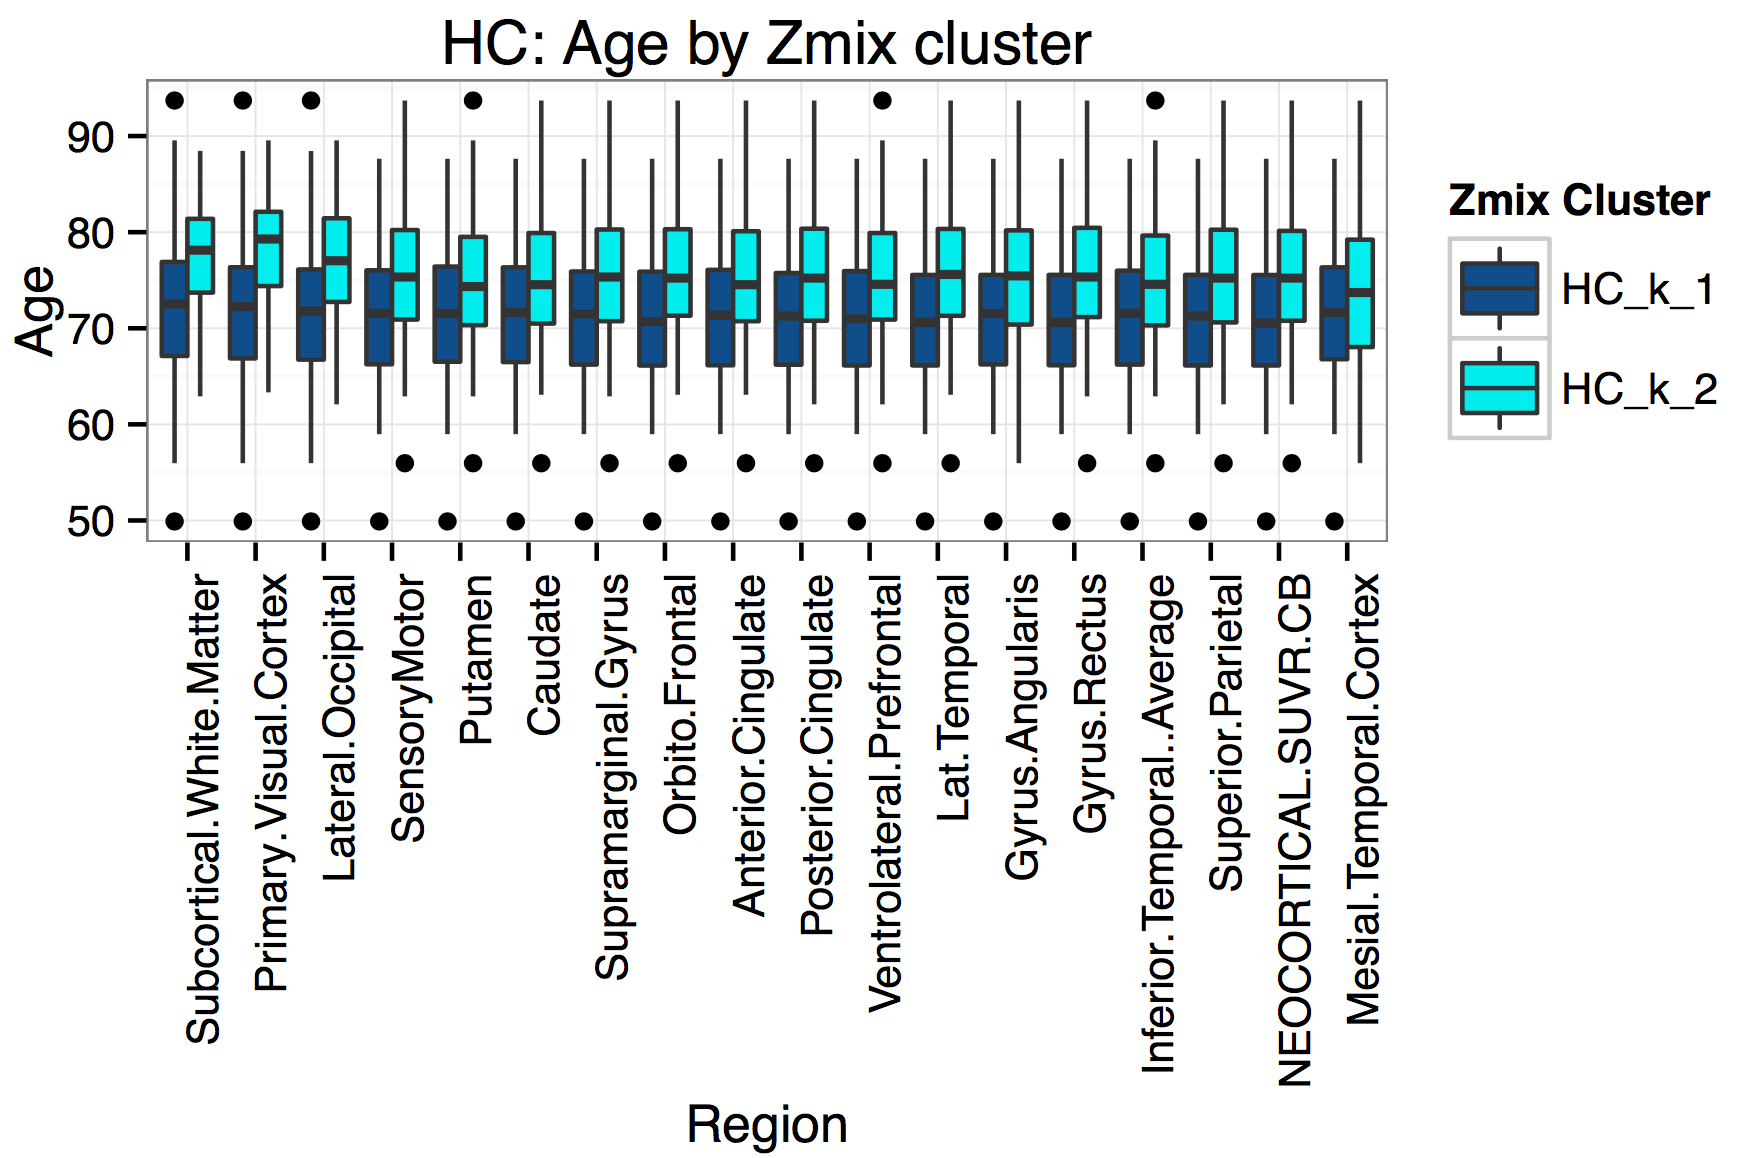
What about other variables?
Age by Group
Memory Complaints by Group

Genotype by Group

Summary of Results
Summary
Zmix found that data-driven Normally distributed groups exist, and these are associated with features of AD.
- Useful as a preliminary analysis.
- Can use to recompute existing metrics.
- Or compute new measures relating to quantities of interest.
So what?
It turns out these findings mimic almost exactly our group's previous results, which were based on:
- \(>\) 10 years of research,
- Big, sophisticated models, and lots of work
- Lots of expert involvement.
Not bad for a bunch of simplistic models!
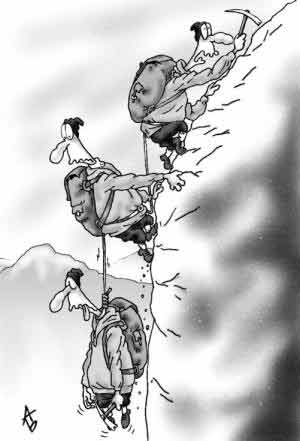
Mountains into molehills…?
Thank you! Zoevanhavre@gmail.com
P.S. I'm available from March 2016… Opportunities welcome.